Category Archives: analytics

DAA Viewthrough Definition Project Seeks Participants


Good news, the Viewthrough Measurement Consortium and the Digital Analytics Association are partnering. We’re pleased to be working with the DAA Standards Committee, who have taken up the viewthrough cause – below is their call for participants.


The viewthrough standardization proposal seeks to establish a foundational definition and inclusion in the DAA glossary.Although this metric is measured by many analytics, research, ad server and ad network platforms, it is little known and understood in comparison to clickthrough. The emerging viewable ad impression while related, is more about ad position and delivery. Viewthrough is about latent ad response and is most easily captured by advertiser-side site analytics like Omniture and CoreMetrics. Even Facebook is offering up their conversion tracking pixel with hopes of leveraging this measure as a means to understand the silent majority of people that do not click on display ads but do respond. 

This project falls under marketing definitions, a new area for the Standards Committee and one with substantial potential as we broaden our standards role. The standards definition project is in the proposal stage and is seeking additional members to set scope and provide input.

Sample Viewthrough Report

If you’d like to participate in the viewthrough project, please contact Domenico Tassone at dtassone (AT) viewthrough DOT org.

For more information about the DAA Standards Committee or to contact the Co-Chairs, reach out to Anna Long and Darrin Wood .

How Crain’s Chicago Got Tech Worker Pay Wrong


http://chicagorelocationblog.com/wp-content/uploads/Crains-Chicago1.jpg

In “Chicago trails other cities in tech salaries and jobs“, the reader is presented with a very misleading article about tech worker pay. Between John Pletz, the woman doing the video interview and the people at Dice, I am not sure how they got this so wrong. Tech workers may look like a bargain but shhh…let’s hope the boss isn’t good at math.

Pletz says:

“Tech talent is in high demand in Chicago these days, and pay is going up. Unfortunately it still lags what techies make in many other big cities…”

 -
 
As the resident tech writer for Crain’s Chicago, Pletz should be aware that he may be chasing tech workers away to Silicon Valley. The table shown, ranks Chicago lowest across what looks like average salaries for tech jobs by city. It looks like Silicon Valley workers are actually better off…with what looks like 19% better pay!
Having lived in there for a few years, that didn’t pass the smell test… 


While it is true those tech workers do make more money, the fact is that when you adjust for cost-of-living, the Chicago tech worker is actually better paid by about 11%. Here is one source of such information: http://www.infoplease.com/business/economy/cost-living-index-us-cities.html ; here is how tech worker pay really stacks up:


Using normalized real dollars, looks like Dallas and Atlanta are the best with Silicon Valley and New York at the bottom. Of course these salaries are averages as are the indexes for cost-of-living – your mileage may vary.
 

Perhaps they were factoring humidity and wind chill?

The "Not Provided" Search Scam

With the recent FTC decision to not pursue Google for rigging search results in their favor, TOTSB was reminded to check in on their clever 2011 organic search scam.  If you too, have been having trouble understanding your organic search traffic with continued growth in “not provided”, you are not the only one. The global change was done under the auspices of security (sounds familiar) but had the back-handed benefit of hampering digital marketers understanding of the very organic keywords that were used to find their sites from the search engine. It is a classic algorithm: 3-for-me-and-1-for-you.

In case, you missed it on October 11, 2011 Google decided to implement Secure Sockets Layer technology for their authenticated (Google, Gmail, YouTube, etc…) search users. In practice, this effectively meant that the referral string that is otherwise passed by Web servers to browsers indicating the referring page URL is truncated. Specifically, while the search engines domain is still included in the referral string, now the actual search queries are excluded. Of course, they certainly track on their end what their users clicked on – this is valuable insight for PageRank..

While often mistaken as an analytics problem, this is actually the case for all site analytics systems. Moreover, this is an organic search problem only; as long as you are paying for Google’s paid search advertising you can have the full referral data inclusive of search queries.

40% and Growing
Back in late 2011, a drone originally calculated the impact as single-digit percentage. Sounds manageable but as more and more stories emerge about much higher percentages this lack of search results transparency becomes more troubling. For your reference, TOTSB decided to take a look at our own site (in both Google Analytics and Piwik) and were shocked to learn as much as 4x the expected amount…and it is  trending higher. Below you can see the “Not Provided” percentage volume increasing since early-2011.


An indepdent SEO firm’s prepared a study that looked at many Web sites but the same problem persists.


Implications
It is pretty clear that if you are interested in optimizing your organic search presence, the hand that giveth has taketh away. With Google’s dominant position in the search market, it essentially means that about half of your organic search keyword results cannot be understood right now. Worse, this remarkably this could continue higher.

The net effect of this move is that Google is denying site owners (the providers of free content to the search engine) their referral information. It is absolutely outrageous that otherwise discerning digital marketers allow this to happen – perhaps class action legal action will emerge. Maybe the W3C or the IAB should get involved and speak out about this perversion of data control.

What to Do?
It is easy enough to track your own Web site’s numbers but beyond that advertisers should start playing hardball and complain – especially those buying paid search. Some are already making noise, including:

  • The organization fairsearch.org will hopefully include “Not Provided” in the scope of their work
  • Notprovidedcount.com: a site tracking “Not Provided” results across 60 different Web sites

Control Your Ad Preferences 2012!

Updated for 2012 and just in time for the Holidays, its Control Your Ad Preferences 2012!


Don’t be a cafone and block ads or delete your cookies…forget what the privacy fanatics and content freeloaders say. TOTSB’s handy reference of major ad control settings panels is here to help. In our continuing effort to ease the privacy data paranoia and highlight consumer control, here is where you can adjust most if not all digital advertising preferences. 2


Overview for 2012
Overall, controlling your ad preferences has gotten easier. It is much simpler to do than correcting information on your credit report. What is interesting is that not all of the tools out there allow you to opt-in as in some cases you might be opted-out through no direct action on your part.

LIMITATIONS: As with all cookie-based systems they are susceptible to cookie blockers, changing computers or delete the NAI opt-out cookie.

Global Cookie Managers
These services have emerged as a one-stop shop for consumers.
  1. PrivacyChoice – Very easy to use and includes Yahoo, Bizo, BlueKai, Exelate tabs (definitely easier to use since 2011). Individual publishers can skin this with their ad partners.
  2. Network Advertising Initiaive (NAI) – The industry’s solution and one of the earliest efforts to give consumers control. If you really don’t want ANY display advertising tailored to you, set your opt-out centrally and then get lots of irrelevant ads – enjoy. In 2012, they made it easier to see the opt-in list compared to opt-outs. However, it is easier to opt-out than it is to opt back in.
  3. TrustEWas new in 2011 as an opt-out approach and competitive to NAI. It has more participants than NAI. Not a bad approach but seeing tracking technologies like Adobe Omniture included here is interesting.
  4. PreferenceCentral – Rub by email house Unsubcentral – looks interesting but not sure what control this really provides yet (no change form 2011)
Specific Advertising Provider Preference Managers
The data providers of the world mostly work behind the scenes but have a variety of services for consumers to control their advertising.
  1. Blue Kai – by far the most interesting with a new interface. Plenty of behavioral ad targeting fodder in here. Also, you can really see the presence of offline credit ratings companies busily creating a whole new revenue stream off of you; interesting that because it is just as creepy yet harder to see. Still, Blue Kai stands out as offering a benefit to charities.
  2. Exelate -They changed the URL in 2012 and improved the interface. Offers many interest categories that can are based on behavior but can be edited.
  3. Lotame – New URL! Fairly innocuous interest and sub-interest categories with observed behavior.
  4. Bizo – Known as the B2B player in the digital advertising data business. Nice approach actually.
  5. Safecount –  from the DynamicLogic (WPP) family comes a totally different approach; with no behavioral segments but plenty of ad creative and sites you’ve been to; no interest preferences here. Actually shows you the creative units.
  6. Amazon – pretty simplistic control over personalization of Amazon ads.
  7. Blue Cava – mobile targeting manager. 
  8. RapLeaf – Opt-out and preference manager; associates to an email address.

Major Consumer Portals
Where people get their email 24×7 and store their personal life’s electronic communiques all for free…somebody has to pay for this storage and bandwidth. Thank you advertisers. Note, these email portal systems are more persistent than anonymous cookie-based platforms since they require users to authenticate. At the same time, they tend to be the most advanced.
  1. Google – Comprehensive and interest-based; no observed behavior included (yet). There is also the Google Dashboard. which offers an integrated way to manage all your Google services – including your search history. Must be signed-in.
  2. Microsoft – Another comprehensive list of interests; no observed behavior.
    Must be signed-in.
  3. Yahoo – Offers a fairly deep interest profile; no observed behavior. Their Ad Interest Manager currently only allows 7 category opt-outs – seems like an odd limit on something that makes the advertising more valuable.
  4. AOL – Pretty simplistic; shows what categories you are in but no control here yet.
  5. AT&TNEW! Control panel based on observed interests; a little clunky but editable.
If anyone has any other suggestions for the above list, please comment or drop TOTSB a line!
Also, in case you were looking for a Flash cookie control panel to view and/remove such locally stored objects: http://bit.ly/2fZi


Last, don’t be evil and enjoy your new Google Toilet ™!


Calling All Analytics Vendors and Ad Networks

There has been an incredible amount of interest and enthusiasm the Viewthrough.org effort from across the ad technology stack, evolving into a real grass-roots Viewthrough Measurement Consortium. Many thanks to all those who have taken the time to share their considerable insights, ideas and candid feedback.


LEARNINGS SO FAR
Below are some key learnings gathered from throughout this process:

  • Nobody is happy about clickthrough measurement and its inherent biases
  • With the DAA and IAB doing their own thing and the emergence of ad viewability as the latest bright shiny object, viewthrough measurement continues to be looked over
  • Most everyone wants better viewthrough measurement but are unsure how to push this forward on their own
  • Many digital advertising companies across the ad tech stack are already measuring viewthrough but don’t necessarily label it viewthrough or they are not breaking it out in their reports today.  
    • Reasons include that it is confusing to clients/agencies that are still focused on last-click attribution; also, that there is that lack of standard definitions, i.e. mention viewthrough and get ready to teach.


It is apparent that analytics and advertising vendors are seeking a meaningful way to report passive display media response. It should be a concern to everyone that many ad networks do not get credit for viewthrough performance today, itself a by-product of slimy performance networks and cookie-stuffing. While the bigger Viewthrough.org strategy evolves (advocacy, research, standards, best practices), there is a definitely tangible step that is low-cost and be taken today.

NEXT STEP: VIEWTHROUGH SCORECARD
Vendors that are already reporting on passive post-exposure response to display media (beyond clickthroughs) ought to consider letting the industry know.Whether it is raw viewthrough visits, a viewthrough rate or viewthrough conversions, now is the time and this is the place.

Below is the current list of vendors known to the Viewthrough Measurement Consortium that provide analytics/reports that specifically containing viewthrough performance:

POST COMMENTS OR SEND FEEDBACK FOR UPDATES.

A Fool and Their Data are Soon Parted

In the post Fear & Loathing in the Ad Technology Stack (3/8/11), TOTSB opined about the latent dangers of having a tag management platform provided by the same vendor as the site analytics solution. Since then, IBM CoreMetrics joined the fray with their Digital Data Exchange solution. Earlier this week, the other and much bigger shoe dropped as Google announced their new and free Tag Manager.

With this latest development, it seemed like a good time to take a look at digital marketers often foolish handling of their customer’s behavioral data. These days such foolishness is like leaving the safe open with money in plain view. Now, let’s take a closer look at what is being offered by Google.

How Does It Work?

The appeal of Google Tag Manager is understandable: “Google Tag Manager is easy, free, and reliable. It gives marketers greater flexibility, and it lets webmasters relax and focus on other important tasks.” Signing-up is easy enough and takes just a few minutes like many other Google tools. Digital marketers can even “opt-out” of anonymously sharing their data for benchmarking purposes. However, this is a faux bone being thrown out by Google that is revealed on a subsequent screen.

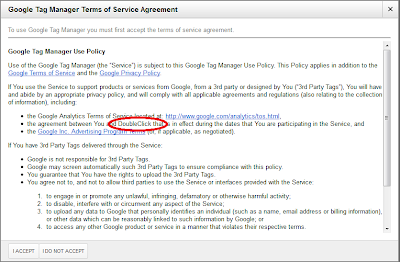
Later, users learn that are actually agreeing to share their data with DoubleClick, Google’s advertising business and signing-up for AdWords, too. It is odd that users must explicitly agree to this to use a Tag Management System. On the final screen you can add then add some 3rd party tags. Conveniently this screen is pre-populated with Google’s Ad Words, DoubleClick Floodlight and Google Analytics tags. Supposedly other tracking tags will be coming soon with such drag-and-drop simplicity. Until then you can add custom code.

Google Tag Manager is:

  • Asynchronous itself and calls 3rd party tags asynchronously which means that slow-loading tags (including itself) won’t slow down page download time.
  • Not server-server…at least that is not yet clear. Meaning tags are literally firing on all requests which is technically a worse engineered solution when simultaneously using other Google products and services. When GTM does go S2S, certainly it will be positioned as a speed benefit…just ignore the looming centralized consolidated Google master cookie.
  • Using a Data Layer. Handy, as it means that there is a way to manage standardized data elements from user behavior on a page or other integrated systems.
  • No SLA. That is what free means; as a result this makes GTM less appropriate for enterprise-sized clients. Perhaps this will be included in Google Analytics Premium.


The Trojan Horse
Now for the rub. Considering the success of Google’s model of free analytics, this move by Google should not be a big surprise. If you weren’t already sharing your data with the Google data-mining machine, now there is one more way for them to get even more breadth of data capture.


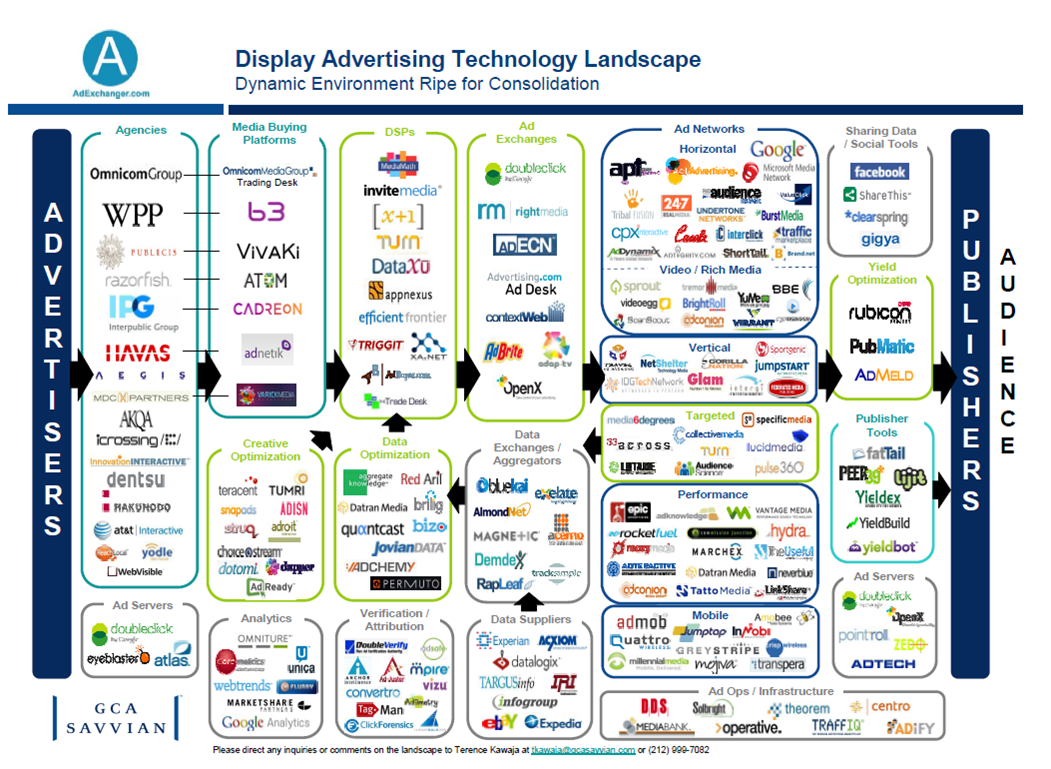
Combined with their the search, free email, social and display media business, Google continues to steadily touch more and more of the entire digital stack. That means they also have maximum user depth, i.e. the full end-to-end view of cause and effect. It is this rich, vast global data set that Google’s engineers have trained their sights on analyzing. The reality is that most digital marketer’s already aren’t technically savvy enough to realize the free Google stack is a digital data Trojan Horse much less do anything about it. When you are used to getting the milk for free why would you want to pay for the cow? Let’s face it – it is a brilliant strategy.

Even if digital marketers decide to forgo Google Analytics and upgrade to a pure-play enterprise analytics solution (not a fake one like Google Analytics Premium), they still have a hole in the data bucket…now thanks to Google Tag Manager. Let’s just call it Google’s little data collection hedge.
 
At the same time, for most Tag Management System vendors this is going to be a really big problem. Google will now commence to eat many TMS’ lunch by putting tremendous price pressure on the market..kind of like dumping. Many digital marketers have already invested in what we can refer to as TMS 1.0 where its all about putting tags in containers albeit through non-server-to-server solutions. Interestingly, many of them are using their paid TMS to deliver their free Google Analytics. Arguably, these clients are the most at risk to Google’s freebies.

Think about it: these TMS 1.0 providers cannot compete any time soon with what will soon be a cloud-based (S2S) architecture. It will be difficult, expensive and risky to change their platforms with many clients and very tedious implementations already behind them. Expect to see more consolidation as a result.

The High Cost of “Free
Most digital marketers have been blissfully unaware of the actual game that they have been playing with Google for years – all under the auspices of free and easy-to-use. Perpetuated by self-appointed experts, there is a popular notion that espouses that analytics technology should be cheap and that it is more valuable to have a well-funded well-paid analytics people…not an expensive tool. The above meme is so Google. It is self-serving and self-reinforcing; it works especially well for the cottage industry of certified implementers and analysts. Unfortunately, it usually also means weak display media measurement, gaping holes in data security/intellectual property control and potentially deep privacy concerns. More tangibly, it could also mean inadvertently feeding your competition through a de facto data co-op while Google makes a buck.

The layers of Google’s conflicts of interest are deep and include:

  • Google Remarketing –  conveniently baked into Google Analytics these days; the Google advertising cookie and the Google Analytics site cookie have been one and the same for some time now
  • Google Analytics – known to overstates Paid Search performance
  • Google Search – recently changed how referral data is passed on  landing pages, thus obfuscating search performance
  • Google Analytics Premium – a thrown bone on fractional attribution and now via DoubleClick Analytics, yet their credibility as an independent arbiter of their own performance is rarely considered

On Being Ethically Challenged About Others’ Intellectual Property
Google’s history is riddled with questionable attitudes towards ownership of other’s data. If your IP attorneys are not paying attention to this – you might need new ones:

Digital Marketer’s Fasutian Bargain
The fact of the matter is that Google is really an advertising company not a technology company. The big question for today’s digital marketers that are considering Tag Manager has not changed. It is the same as the Google Analytics question, i.e. is your company’s most valuable asset (customer’s behavioral data) worth more than the cost of not sharing it with the best data-mining conglomerate in the world? For many smaller companies the answer could be no, but for many largeradvertisers the answer should be – thanks, but no thanks.

Google’s latest self-serving, 3-for-me and 1-for-you offering should really motivate digital marketers to start to think differently about their value of their data, how much they trust others with it and what they need to do next to securely and exclusively control their data. Smart advertisers need to really start paying attention to how much data they are really sharing with a company that Sir Martin Sorrel best referred to as a “frenemy“…and that was way back in 2007. So much for do no evil.

The good news is that it doesn’t have to be this way.

How to Remove Google from your Ad Stack
Others are also noticing Google’s move and that digital marketers do have other alternatives…they are just not free. Back to using common-sense and ROI/TCO analysis to justify technology investments…or risk sharing your data with Google and the competition.

Here are some thought-starters:

  • Tag Management. Best choice at this point: BrightTag. Yes, I am an advisor. However, the reason I am is because only BrightTag has looked beyond tags on pages to the underlying problem of the data transport layer. Unlike the other TMS 1.0 platforms, BT has already a few years into developing a powerful TMS 2.0 tool; it is based on a highly scalable cloud-based infrastructure that offers digital marketer’s a real alternative to Google’s encroaching data glom. The good news is that most everyone that matters is already server-server integrated with BT…except of course (wait for it…)…Google’s products (Google Analytics, Floodlights, AdWords).
  • Analytics: Adobe, ComScore’s Digital Analytix and if you must IBM CoreMetrics
  • Ad Server: MediaMind, Pointroll, MediaPlex and if you must Atlas……not Google Analytics
  • Search Management: Kenshoo, Adobe, Marin…anything but DART Search
  • Attribution: Adometry, Visual IQ have better methodologies…C3, Convertro, Clearsaling…not Google Analytics or DFA.
  • Demand Side Platform: MediaMath, Turn, DataXu…not Bid Manager (formerly Invite Media).

The truth of the matter should be getting clearer to savvy digital marketers. If not, bring in independent viewpoints that are not invested in this madness. Good luck!

For publishers this is a much more complex proposition and the subject of a future post.

Proposed Definition of an Ad Viewthrough

Viewthrough (view-through) is a measure of the passive but self-directed response from paid media (banner, rich media, video or audio). For starters:

  • Scope
    • Post-impression viewthrough follows from one or more ad exposures where there was no click event
    • Although the focus here is on display media, viewthrough or passive response could come from email, affiliate advertising, online PR and “darksocial media
    • Apart from Google’s self-serving studies, no independent research validates the notion of a paid search viewthrough
  • Relation to Clickthrough
    • Distinguished from post-click visitation or conversion
  • Measurement
    • Can be a success metric like a conversion, high-value task or a site visit
    • Can be measured by a brand on its’ own Web properties through site analytics
    • Can be measured more broadly (competitor/peer site visitation, search, etc…) through panel-based research
    • May be subject to attribution rules, such as first touch, last touch, equal touch or staistically derived techniques
  • Time
    • Is subject to a lookback and lookahead window that is configured by the ad server
    • Viewthrough impact decays over time from the initial ad exposure
  • Calculation
    • The VTR (viewthrough rate) is calculated as # of viewthrough / # of impressions (viewed impressions preferably)
    • Impressions should be based on “viewed” or “viewable” for most accurate measurement
    • In-flight viewthrough are observed during a live ad campaign, while the post-flight viewthrough “vapor-trail” can be observed when the campaign ends or is paused
If you have feedback, please reach out or comment below!

Viewthrough & Incrementality Testing

A common question in digital marketing measurement is “what was the lift?” or “what is the incremental benefit?” from a particular promotional campaign. Most of us would agree that the alternative of relying on display ad clicks alone for display response measurement is just wrong. When measuring display media, incrementality testing is absolutely essential to properly gauge the baseline viewthrough effect.

How to Calculate Incremental Cost Borrowing thumbnail

In order to answer this question, a test and control methodology (or control and exposed) should be used, i.e. basic experimental design where a control group is held out that otherwise are identical to the group that is being tested with the marketing message. This is even more important when marketing “up the funnel” where a last click or even last touch measurement from a site analytics platfom will mask impact.

Email marketers have been doing this with their heritage in direct marketing technqiues. It is often pretty straight forward as the marketer knows the entire audience or segment population and holds back a statistically meaningful group; this will enable them to make a general assertion about what the campaign’s actual lift or incremental benefit is. Control and exposed can also be done with display media if the campaign is configured properly to split audiences, elimnate overlap and show the control group a placebo ad. Often PSAs (public service ads) are used, which can be found via the AdCouncil.

This technique is routinely used for qualitative research, i.e. brand lift study services like Vizu, InsightExpress, Dynamic Logic and Dimestore. It is the best way to isolate the impact of the advertising; read more about the challenges of this kind of audience research in Prof. Paul Lavrakas study for the IAB.

Calculating Lift and Incrementality

Dax Hamman from Chango and Chris Brinkworth from TagMan were recently kicking around some numbers to illustrate how viewthrough can be measured; some of that TOTSB covered a while back in Standardizing the Definition of Viewthrough For the purposes of this example, clickthrough-derived revenue will be analyzed separately and fractional attribution will not be addressed. In this example, both control and exposed groups are the same size though this can be expensive and is usually unnecessary using statistical sampling.

  • Lift is the percentage improvement = (Exposed – Control)/Control
  • Incrementality is the beneficial impact = (Exposed – Control)/Exposed

In addition to understanding the lift in rates like viewthrough visit rate, conversion rate and yield per impression by articulating incrementality rate the baseline percentage is revealed – it is just the reciprocal of incrementality (100% = incrementality % + baseline %). Incrementality or incremental benefit, can be used to calibrate other similar campaigns viewthrough response – “similar” being the operative word.

Executing an Incrementality Test

PSA studies are simple in concept but often hard to run. Some out there advocate a virtual control, which is better than no control but not recommended. This method does provide a homegenous group from an offline standpoint so if all things being equal TV and circular are running then it is safe to assume both test and control should be exposed to the rest of the media mix equally. ComScore even came up with a clever zero-control predicted metholdology for their SmartControl service.

Most digital media agencies have experience designing tests and setting up ad servers with the exact same audience targeting criteria across test and control. Better ad networks out there encourage incrementality testing and will embrace the opportunity to understand their impact beyond click tracking.

Was this helpful? If so, let me know and I’ll share more.